23  Network Visualisation

Interactive maps of entire UK air quality monitoring networks

Author

Jack Davison

Abstract
Using importMeta() provides a simple, tabular data set of monitoring stations. This is useful if users have specific sites, pollutants or local authorities in mind, but it is difficult to get a feel for the geographic distribution of a monitoring network. This section details how networkMap() can allow readers to visualise and explore any UK monitoring network.

23.1 Introduction

openair makes it easy to access any of the UK’s air quality monitoring networks. The following networks are available:

  • The Automatic Urban and Rural Network (AURN), the UK’s national network.

  • The devolved UK networks; Air Quality England (AQE), Scotland (SAQN), Wales (WAQN) and Northern Ireland (NI).

  • Locally managed English networks operated by individual local authorities.

  • The Imperial College London (formerly Kings College London) network.

Lets consider the metadata available for the AURN.

library(openair)
aurn_meta <- importMeta(source = "aurn", all = TRUE)
dplyr::glimpse(aurn_meta)
Rows: 2,889
Columns: 14
$ source          <chr> "aurn", "aurn", "aurn", "aurn", "aurn", "aurn", "aurn"…
$ code            <chr> "ABD", "ABD", "ABD", "ABD", "ABD", "ABD", "ABD", "ABD"…
$ site            <chr> "Aberdeen", "Aberdeen", "Aberdeen", "Aberdeen", "Aberd…
$ site_type       <chr> "Urban Background", "Urban Background", "Urban Backgro…
$ latitude        <dbl> 57.15736, 57.15736, 57.15736, 57.15736, 57.15736, 57.1…
$ longitude       <dbl> -2.094278, -2.094278, -2.094278, -2.094278, -2.094278,…
$ variable        <chr> "O3", "NO", "NO2", "NOx", "SO2", "CO", "PM10", "NV10",…
$ Parameter_name  <chr> "Ozone", "Nitric oxide", "Nitrogen dioxide", "Nitrogen…
$ start_date      <dttm> 2003-08-01, 1999-09-18, 1999-09-18, 1999-09-18, 2001-…
$ end_date        <chr> "2021-09-20", "2021-09-20", "2021-09-20", "2021-09-20"…
$ ratified_to     <dttm> 2021-09-20, 2021-09-20, 2021-09-20, 2021-09-20, 2007-…
$ zone            <chr> "North East Scotland", "North East Scotland", "North E…
$ agglomeration   <chr> NA, NA, NA, NA, NA, NA, NA, NA, NA, NA, NA, NA, NA, NA…
$ local_authority <chr> "Aberdeen City", "Aberdeen City", "Aberdeen City", "Ab…
This dataset has 2889 rows and 14 columns, which is a lot of information to explore in a tabular format. A more effective way to communicate this information could be a map, which can be created automatically using openairmaps.

23.2 The networkMap() function

Network visualisation is the simplest family of functions in openairmaps — in fact, it only has one member. networkMap() is a function which you can consider as an analogue to importMeta() from openair. Consider networkMap() as an analogue to importMeta() — it can map any of the sources that importMeta() can, using the same codes ("aurn", "saqn", "local", "kcl", etc.) to select sites. Figure 23.1 visualises the active AURN sites as of 2025-01-07.

library(openairmaps)
networkMap(source = "aurn")
Figure 23.1: An interactive map of the AURN monitoring network.

networkMap() is a quite simple function, with the following arguments for customisation:

  • source: Any number of the importMeta() sources — can be “aurn”, “saqn” (or “saqd”), “aqe”, “waqn”, “ni”, “local”, “kcl” or “europe”.

  • control: Any column of the equivalent importMeta() dataset, which is used to create a “layer control” menu to allow readers to filter for certain sites. The control option is quite opinionated, and selects an appropriate style of layer control depending on the column selected (e.g., pollutants are switched between, whereas multiple site types can be selected at once)

  • date: By default, networkMap() shows currently active monitoring sites. By specifying date, sites active at that date will be shown. This may be of interest if you want to explore the history of your chosen monitoring site. Dates can either be provided as a character string in the “YYYY-MM-DD” format, or alternatively as a single year (e.g., date = 2020) which will show sites still operational at the end of that year.

  • cluster: By default, markers are clustered together until users zoom in close. This default behaviour improves the appearance and performance of the HTML map widget. The cluster argument allows you to turn this feature off.1

  • provider: Any number of the leaflet providers (see leaflet::providers or the list in the openairmaps overview page).

Some of these arguments are demonstrated in Figure 23.2, which shows the AURN, AQE Network, and locally managed English networks.2 Pay particular attention to the layer control menu, which allows you to toggle different site types on and off.

networkMap(source = c("aurn", "aqe", "local"),
           control = "site_type")
Figure 23.2: Demonstrating more features of networkMap().

23.2.1 “Do It Yourself” Network Maps

If you are only interested in a few sites, you may wish to create your own, smaller network map. Currently, openairmaps only contains functionality to visualise entire networks, but it is relatively easy to create a map of your own using leaflet. While Figure 23.3 shows a network map of just sites in York, its associated code chunk can be used as a template for other small network maps. It uses the buildPopup() function from openairmaps which was written for use with the directional analysis mapping functions, so is described in greater detail on the next page.

library(leaflet)
library(dplyr)
library(stringr)

# import all Meta data for the AURN
aurn_meta <- openair::importMeta("aurn", all = TRUE)

# prep data for leaflet
map_data <- 
  aurn_meta %>%
  # get sites in York
  filter(local_authority == "York") %>% 
  # build a popup
  buildPopup(
    latitude = "latitude",
    longitude = "longitude",
    columns = c(
      "AURN Code" = "code",
      "Name" = "site",
      "Site Type" = "site_type",
      "Zone" = "zone",
      "LA" = "local_authority"
    )
  ) %>%
  # get unique sites
  distinct(site, .keep_all = TRUE)

# create a basic leaflet map
leaflet(map_data) %>%
  addTiles() %>%
  addMarkers(popup = ~popup)
Figure 23.3: Demonstrating more features of networkMap().

23.3 Searching Networks

networkMap() is a useful function to view entire monitoring networks, but your specific use-case may be much more local. The searchNetwork() function is designed to find sites local to a specific location of interest, defined using latitude/longitude (or other Y/X) coordinates. You may wish to define your location of interest to be a likely source, like an industrial installation, quarry, or the site of a (wild)fire. Alternatively, if you are examining pollutant exposure at a specific location (e.g., a school or a hospital) you may wish to find out where the closest air quality monitors are.

For example, let’s imagine that we’re interested in pollutant concentrations near to Great Ormond Street Hospital, a famous children’s hospital in the UK. openairmaps provides the convertPostcode() function to let us easily get the coordinates of this site.

hospital <- convertPostcode("WC1N 3JH")
hospital
$lat
[1] 51.52221

$lng
[1] -0.119924

$postcode
[1] "WC1N 3JH"

Let’s plug this straight into searchNetwork() looking at AURN and AQE sites. Figure 23.4 is the result - you’ll see by default the whole network is returned, far too much detail than we require!

searchNetwork(
  lat = hospital$lat,
  lng = hospital$lng,
  source = c("aurn", "aqe")
)
Figure 23.4: Searching the whole network!

searchNetwork() provides a few arguments to filter down the sites to a more sensible level. These include site_type and variable which can filter based on the site type and the pollutants measured, max_dist to define a maximum distance from the location of interest, and n which defines a maximum number of sites to show. All of these constraints are shown on the map at the bottom-right. This is all shown on Figure 23.5.

searchNetwork(
  lat = hospital$lat,
  lng = hospital$lng,
  source = c("aurn", "aqe"),
  year = 2022,
  max_dist = 2,
  n = 4
)
Figure 23.5: Filtering the metadata down to a sensible level.

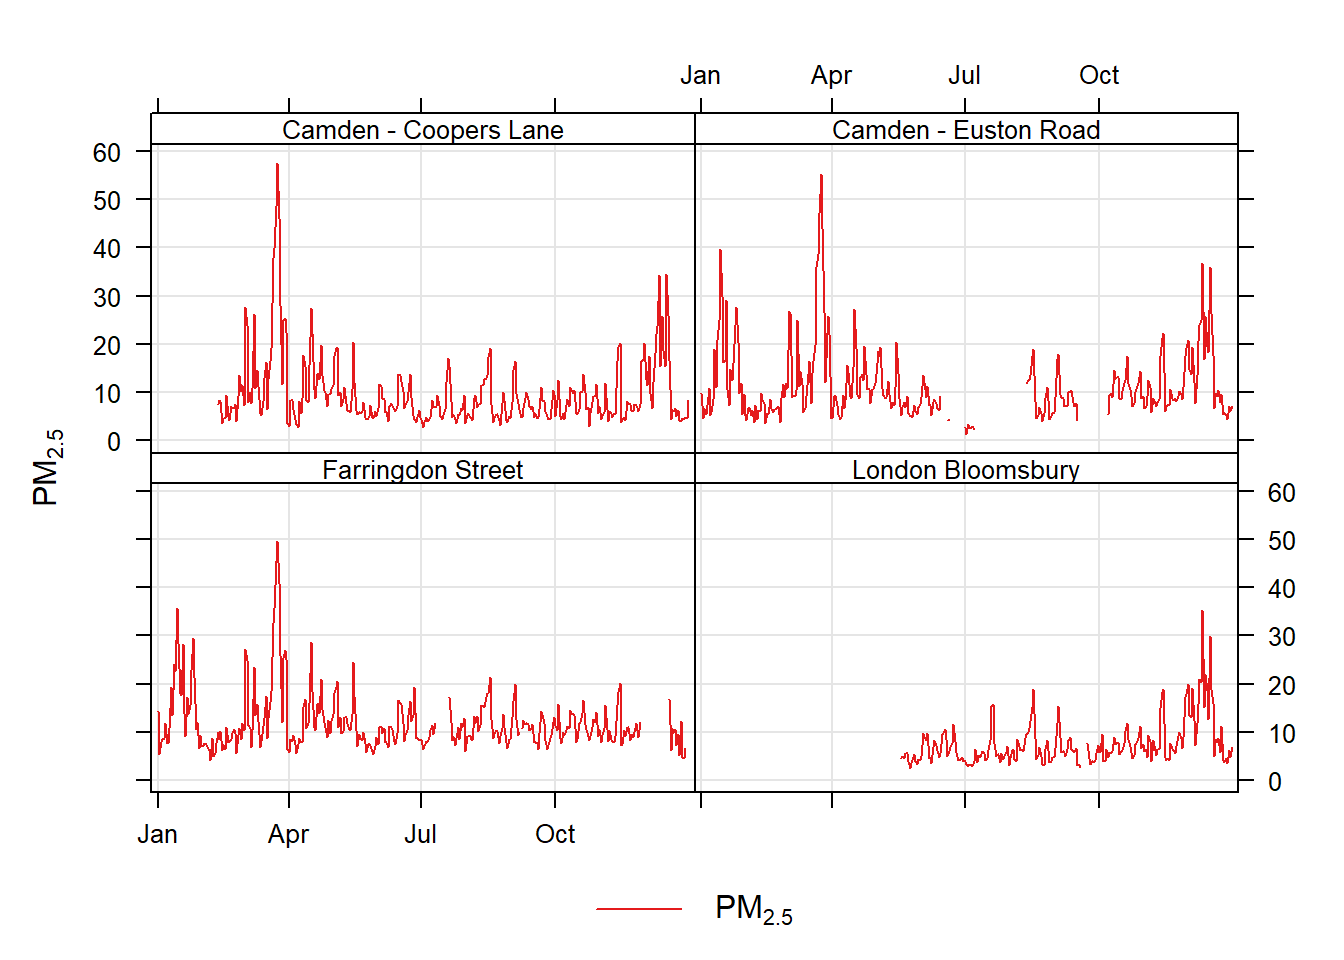
Now we’ve found our sites, we can instead return them in a table. These could then be plugged straight into importUKAQ() and analysed using openair.

hospital_meta <-
  searchNetwork(
    lat = hospital$lat,
    lng = hospital$lng,
    source = c("aurn", "aqe"),
    year = 2022,
    max_dist = 2,
    n = 4,
    map = FALSE
  )

# view table of metadata
hospital_meta
# A tibble: 4 × 9
  source code  site       latitude longitude site_type zone  agglomeration  dist
  <chr>  <chr> <chr>         <dbl>     <dbl> <chr>     <chr> <chr>         <dbl>
1 aurn   CLL2  London Bl…     51.5    -0.126 Urban Ba… Grea… Greater Lond… 0.413
2 aqe    CD009 Camden - …     51.5    -0.129 Urban Tr… Grea… Greater Lond… 0.886
3 aqe    CT2   Farringdo…     51.5    -0.105 Urban Tr… Grea… Greater Lond… 1.35 
4 aqe    KX004 Camden - …     51.5    -0.130 Urban In… Grea… Greater Lond… 1.40 
hospital_aq <-
  openair::importUKAQ(site = hospital_meta$code,
                      year = 2022,
                      source = hospital_meta$source)

openair::timePlot(
  hospital_aq,
  pollutant = c("pm2.5"),
  type = "site",
  avg.time = "day"
)
Figure 23.6: A timeplot of air quality near Great Ormond Street Hospital.

  1. This feature cannot be turned off when network = "europe" due to the number of markers creating performance issues.↩︎

  2. Note that networks can overlap — AQE sites can be part of the AURN. networkMap() uses the user-provided order as a hierarchy, so if “aurn” is listed first, an AURN & AQE site will be labelled as part of the AURN and its AURN code will be displayed↩︎