install.packages("worldmet")4 Access meteorological data
Abstract
Meteorological data is key to understanding air quality measurements. This section describes a fast and convenient way of accessing meteorological data for sites worldwide.
4.1 The worldmet package
Most of the import functions described in Chapter 3 return basic modelled hourly meteorological data (wind speed, wind direction and surface temperature). These data are derived from the WRF model that WSP runs to provide the data.
Alternatively it may be advantageous to use surface measurements. worldmet provides an easy way in which to access surface meteorological data from >30,000 sites across the world. The package accesses the NOAA webservers to download hourly data. See https://github.com/openair-project/worldmet and https://www.ncei.noaa.gov/products/global-historical-climatology-network-hourly for further information.
Access to surface meteorological data is very useful in general but is especially useful when using openair and functions such as polarPlot(). To install the package, type:
To learn which monitoring stations are available, the import_ghcn_stations() function is provided. By default, this function returns all data as a data.frame, but can usefully also return it as a map using return = "map". As an example, we will search for the 10 nearest sites to Dublin (latitude = 53.3, longitude = -6.3).
import_ghcn_stations(lat = 53.3, lng = -6.3, return = "map")Note that it is just as easy to access all the site information at once because it is quick to use the map to select the site and its code.
import_ghcn_stations(return = "map")We can use the map that is produced to select a site of interest and import the data. For example, to import data for Dublin Airport and look at some of the data:
dublin_met <- import_ghcn_hourly("EII0000EIDW", year = 2019)

# first few lines of data
dublin_met
# A tibble: 8,760 × 42
station_id station_name lat lng elev date wd ws
<fct> <fct> <dbl> <dbl> <dbl> <dttm> <dbl> <dbl>
1 EII0000EIDW DUBLIN 53.4 -6.27 73.8 2019-01-01 00:00:00 250 5.05
2 EII0000EIDW DUBLIN 53.4 -6.27 73.8 2019-01-01 01:00:00 245. 4.8
3 EII0000EIDW DUBLIN 53.4 -6.27 73.8 2019-01-01 02:00:00 250 4.05
4 EII0000EIDW DUBLIN 53.4 -6.27 73.8 2019-01-01 03:00:00 250 4.55
5 EII0000EIDW DUBLIN 53.4 -6.27 73.8 2019-01-01 04:00:00 255. 5.35
6 EII0000EIDW DUBLIN 53.4 -6.27 73.8 2019-01-01 05:00:00 260 5.05
7 EII0000EIDW DUBLIN 53.4 -6.27 73.8 2019-01-01 06:00:00 260 4.8
8 EII0000EIDW DUBLIN 53.4 -6.27 73.8 2019-01-01 07:00:00 256. 4.55
9 EII0000EIDW DUBLIN 53.4 -6.27 73.8 2019-01-01 08:00:00 270 5.05
10 EII0000EIDW DUBLIN 53.4 -6.27 73.8 2019-01-01 09:00:00 265. 4.8
# ℹ 8,750 more rows
# ℹ 34 more variables: air_temp <dbl>, atmos_pres <dbl>, visibility <dbl>,
# dew_point <dbl>, rh <dbl>, cl <dbl>, cl_baseht <dbl>,
# cl_layer_1_okta <dbl>, cl_layer_2_okta <dbl>, cl_layer_3_okta <dbl>,
# cl_layer_4_okta <lgl>, cl_layer_baseht_1 <dbl>, cl_layer_baseht_2 <dbl>,
# cl_layer_baseht_3 <dbl>, cl_layer_baseht_4 <lgl>, cl_summation_1 <lgl>,
# cl_summation_2 <lgl>, cl_summation_3 <lgl>, cl_summation_4 <lgl>, …Plot a wind rose.
windRose(dublin_met)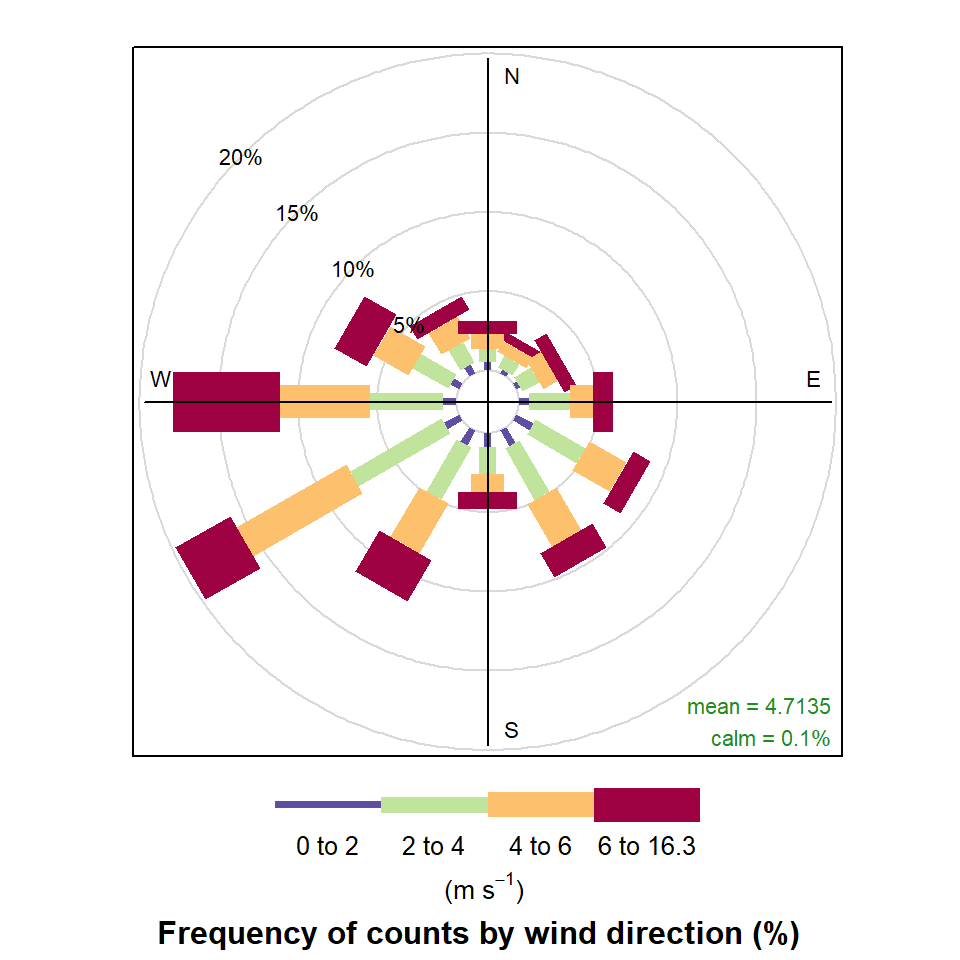
4.2 Linking with air quality data
Having imported some meteorological data it will often be necessary to combine it with air quality data. Quite how this is done depends on the air quality data. The important point is there should be a date column in each data set that make the connection between the two. It may also depend on whether the air quality data has existing fields that also exist in the meteorological data e.g. ws, wd and air_temp, as is the case with most data accessible as described in Chapter 3. In this case, the aim to to replace any existing meteorological variables in the air quality data with those in the meteorological data. An example is shown below.
# import some air quality data and check the variables that exist
# `meteo = FALSE` does not import the modelled met data
aq_2019 <- importUKAQ(site = "kc1", year = 2019, meteo = FALSE)
names(aq_2019)
[1] "source" "site" "code" "date" "co" "nox" "no2" "no"
[9] "o3" "so2" "pm10" "pm2.5" # import some met data from London City Airport
met_2019 <- import_ghcn_hourly("UKI0000EGLC", year = 2019)
# join the two datasets, selecting a sample of the met data
aq_met <- left_join(
aq_2019,
select(met_2019, date, ws, wd, air_temp),
by = "date"
)
names(aq_met) [1] "source" "site" "code" "date" "co" "nox"
[7] "no2" "no" "o3" "so2" "pm10" "pm2.5"
[13] "ws" "wd" "air_temp"With joined data, we can now create openair plots using measured meteorological data. For example, polarPlot() requires both air quality and meteorological data in one data.frame:
polarPlot(aq_met)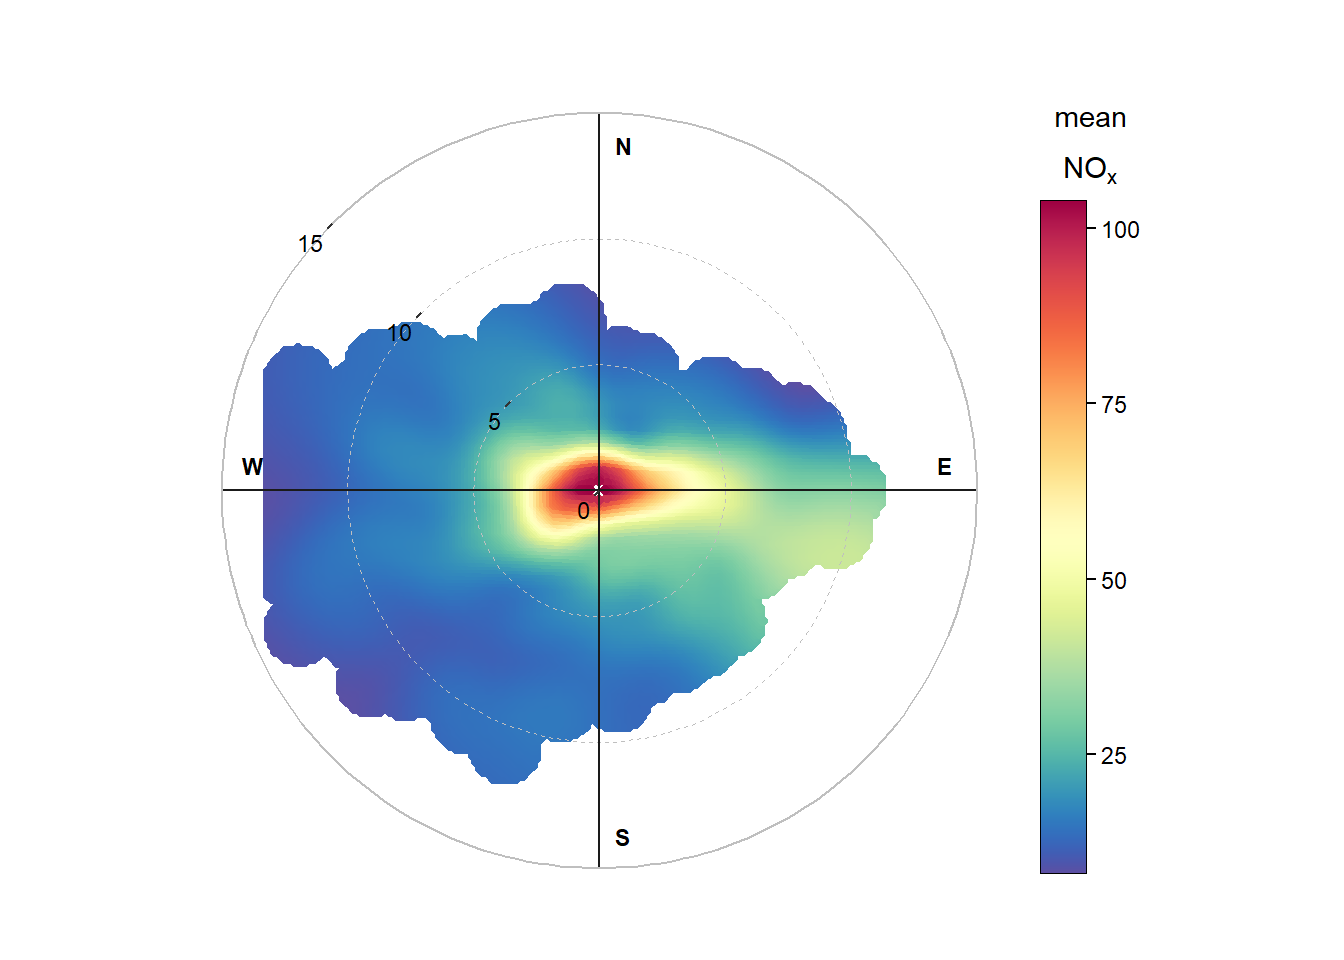
polarPlot() created using measured met data from London City Airport.