This function provides a convenient way to set default options for ref.x or
ref.y layers in openair plots, which show some form of horizontal or
vertical reference line. intercept can be a vector of any length; all other
arguments will be recycled to be equal to that length.
Usage
refOpts(
  intercept,
  alpha = 1,
  colour = "black",
  linetype = 1,
  linewidth = 0.6,
  label = NULL,
  label_size = 10,
  label_colour = NULL,
  color = NULL,
  label_color = NULL
)
Arguments
- intercept
The axis intercept(s) for the reference lines. Should be numeric, dates, or date-times depending on the axis types. If another data type is provided, it will attempt to be coerced to the correct type using
as.numeric(),lubridate::as_date()orlubridate::as_datetime(), respectively.- alpha
Numeric value between 0 and 1 specifying the transparency of the lines. Default is 1 (fully opaque).
- colour, color
Colour of the lines. Default is
"black".colourandcolorare interchangeable, butcolouris used preferentially if both are given.- linetype
Line type. Can be an integer (e.g., 1 for solid, 2 for dashed) or a string (e.g., "solid", "dashed"). Default is 1 (solid).
- linewidth
Numeric value specifying the width of the lines. Default is 1.
- label, label_size, label_colour, label_color
labeltakes character string to add a direct label to the reference line. Forref.xthis will be on the right hand side of the plot, and forref.ythis will be on top.label_sizeandlabel_colourset label aesethetics, with the latter defaulting tocolourif not set.
Value
A list of options that can be passed to the ref.x or ref.y
arguments of functions like timePlot().
Examples
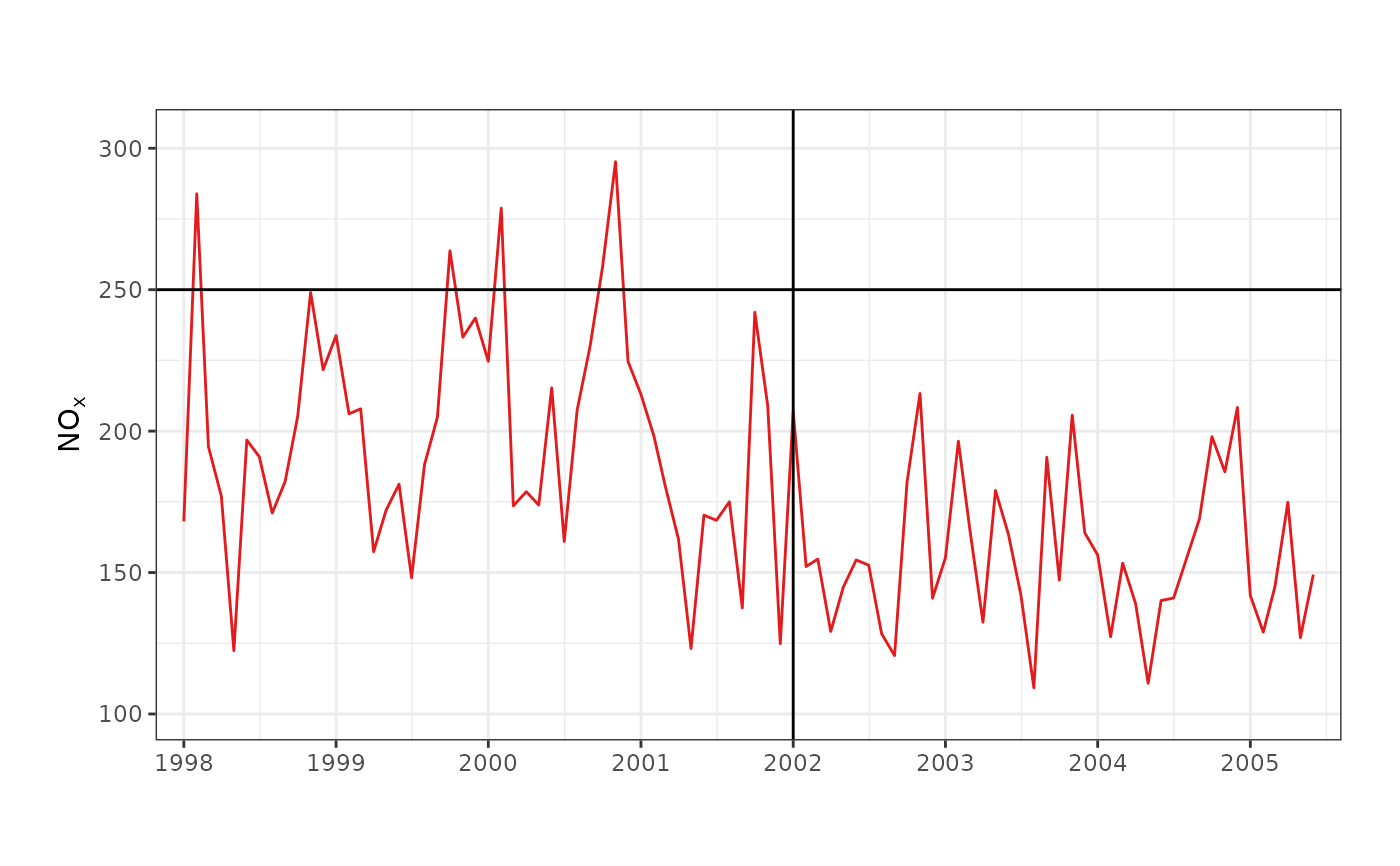
# `ref.y` can just be a value to plot
timePlot(mydata, avg.time = "month", ref.y = 250, ref.x = "2002/01/01")
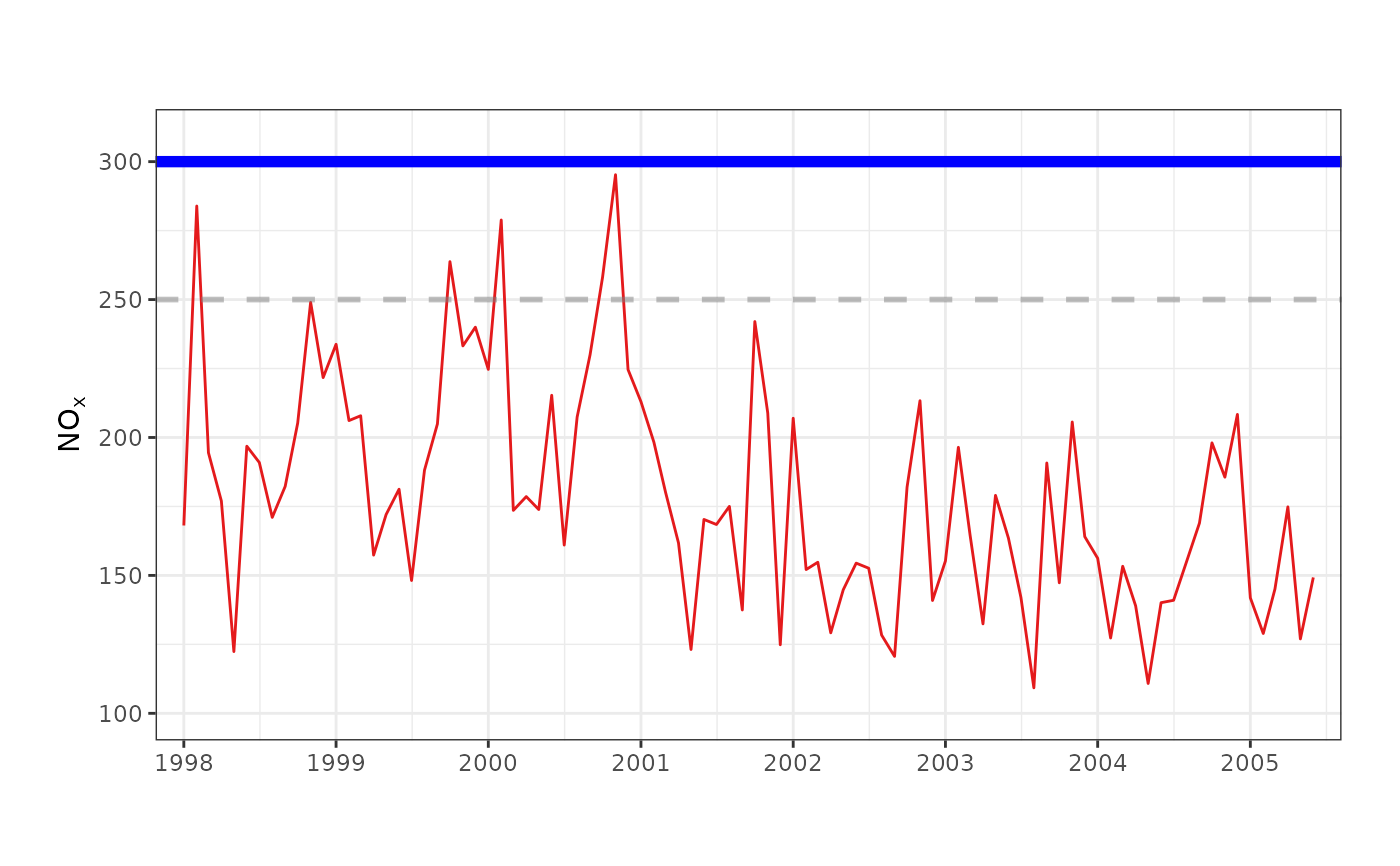
 # use the `refOpts()` function to customise reference lines
timePlot(
mydata,
avg.time = "month",
ref.y = refOpts(
c(250, 300),
alpha = c(0.5, 1),
colour = c("grey50", "blue"),
linetype = c(2, 1),
linewidth = c(1, 2)
)
)
# use the `refOpts()` function to customise reference lines
timePlot(
mydata,
avg.time = "month",
ref.y = refOpts(
c(250, 300),
alpha = c(0.5, 1),
colour = c("grey50", "blue"),
linetype = c(2, 1),
linewidth = c(1, 2)
)
)