This function provides a convenient way to set options for customising
colours in openair plots. It returns a list of options that can be passed to
the cols argument of most functions. All arguments are the same as
openColours(), but passing colourOpts() allows each function to set an
appropriate n value and overwrite certain options if required.
colourOpts() and colorOpts() are synonyms.
Usage
colourOpts(
  scheme = "default",
  alpha = 1,
  begin = 0,
  end = 1,
  direction = 1,
  saturation = 0.5,
  lightness = 0.5
)

colorOpts(
  scheme = "default",
  alpha = 1,
  begin = 0,
  end = 1,
  direction = 1,
  saturation = 0.5,
  lightness = 0.5
)
Arguments
- scheme
Any one of the pre-defined
openairschemes (e.g.,"increment") or a user-defined palette (e.g.,c("red", "orange", "gold")). UseopenSchemes()for a full list of available schemes.- alpha
The alpha transparency level (between
0and1) for the colours.0is fully transparent, and1is fully opaque.- begin, end
For sequential schemes, the fraction (between
0and1) of the colour scheme to use. For example, ifbegin = 0.2andend = 0.8, only the middle 60% of the colour scheme will be used. This can be useful for avoiding very light or dark colours at the ends of schemes.- direction
The order of the colours.
1is the default and gives the normal order.-1will reverse the order of the colours.- saturation
The saturation of the colours, between
0(completely desaturated, i.e., grey) and1(completely saturated). The default is0.5, which gives the original saturation of the colours. Values less than0.5will make the colours more desaturated (greyer), and values greater than0.5will make the colours more saturated (vibrant).- lightness
The lightness of the colours, between
0(completely black) and1(completely white). The default is0.5, which gives the original lightness of the colours. Values less than0.5will make the colours darker, and values greater than0.5will make the colours brighter.
Value
A list of options that can be passed to the cols argument of
plotting functions like polarPlot().
See also
Other colour functions:
openColours(),
openSchemes()
Examples
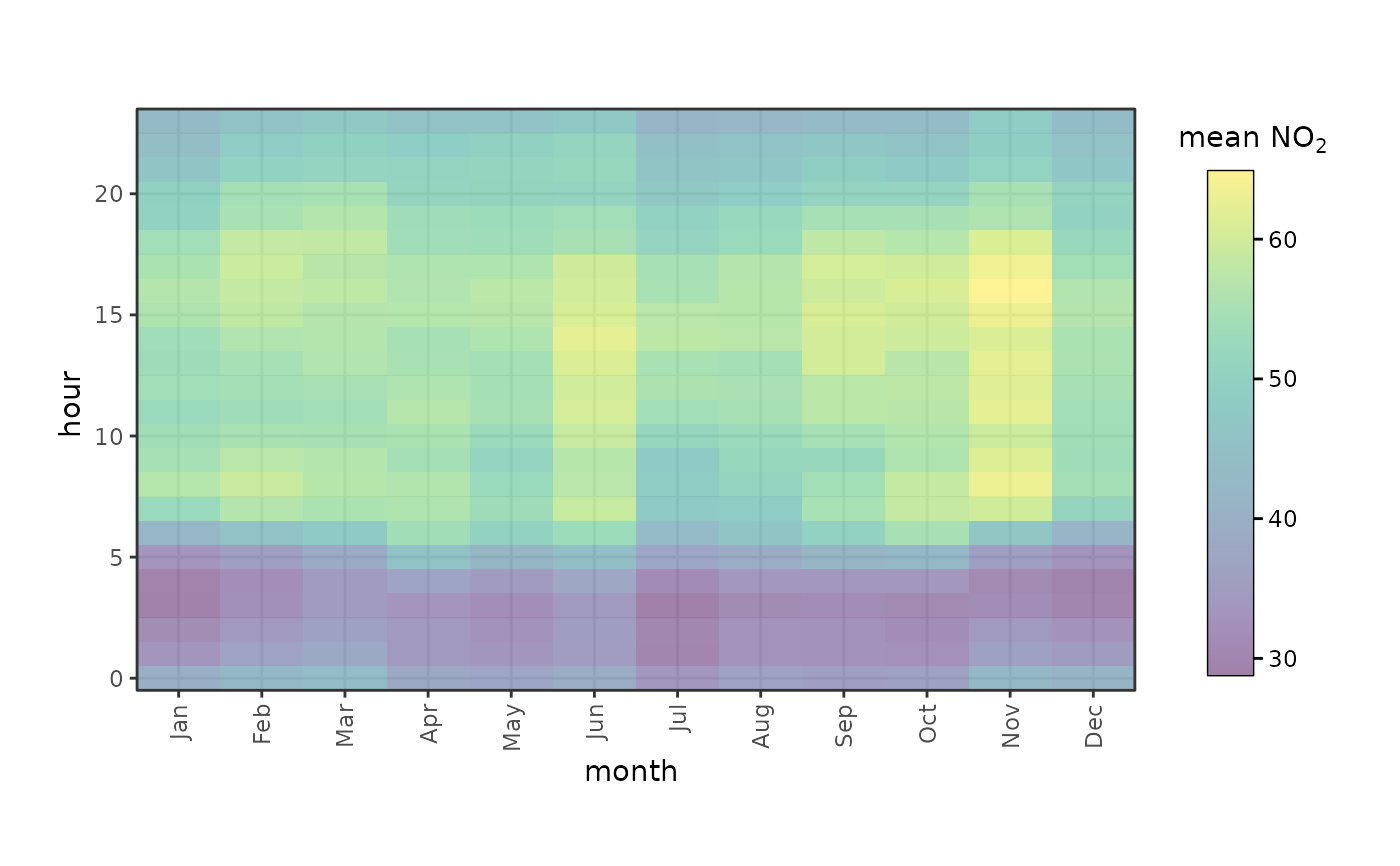
trendLevel(
  mydata,
  "no2",
  cols = colourOpts("viridis", direction = 1, alpha = 0.5)
)